
Short Answer
Franz Josef Land (Russian: Земля Франца‑Иосифа) is a high‑Arctic archipelago of roughly 190 islands in the Barents Sea, extending from 79° to 82° N. Its ice‑covered terrain, dominated by dome‑shaped ice caps and outlet glaciers, accounts for more than 85 % of the archipelago’s surface. Over the past two decades, the region has experienced some of the most rapid glacier changes observed in the Russian Arctic, with thinning, retreat, and an accelerating mass‑loss signal that now rivals that of neighboring Arctic islands.
Understanding these changes requires a synthesis of historic cartography, early field observations, and modern remote‑sensing techniques. The combined evidence shows a clear shift from near‑neutral mass balance in the early 2000s to a pronounced negative trend after 2010, driven primarily by atmospheric warming and, to a lesser extent, oceanic heat fluxes. This article reviews the scientific evidence, measurement methods, and emerging uncertainties surrounding glacier change in Franz Josef Land.
Study Area
The archipelago lies between the Barents Sea to the west and the Kara Sea to the east, spanning roughly 7,000 km² of ice‑covered terrain. The largest ice‑filled islands—such as Rudolf Island (Остров Рудольфа), Hall Island (Остров Холла), and Jackson Island (Остров Джексона)—host the majority of the ice mass. Elevations range from sea level to the summit of the highest ice dome, the 935 m‑high Kupol Greben (Купол Гребен) on Rudolf Island. The region is administratively part of Arkhangelsk Oblast and is protected within the Russian Arctic National Park, established in 2009.
What Scientists Measure
Glacier change is quantified through several complementary data streams:
- Satellite stereo optical imagery (WorldView‑2/3, SPOT‑5) provides high‑resolution digital elevation models (DEMs) that capture surface elevation change (dh/dt) at 1–2 m spatial resolution.
- Radar altimetry from CryoSat‑2 supplies repeat surface height measurements over broad swaths, enabling regional thinning rates and validation of optical DEMs.
- Historical cartography—a digitized 1953 topographic map derived from aerial surveys—serves as a baseline for long‑term change detection.
- Gravimetric observations (GRACE) and laser altimetry (ICESat) offer basin‑scale mass‑balance estimates, albeit with coarser spatial resolution.
These datasets are processed to derive volume change, which is converted to mass loss using a density of 850 kg m⁻³ for firn‑to‑ice conversion. Uncertainties stem from DEM registration errors, radar footprint variability, and density assumptions.
Historical Evidence
Early Arctic expeditions—most notably the Austro‑Hungarian North‑Pole Expedition (1872‑73) and the Jackson–Harmsworth Expedition (1894‑95)—provided the first qualitative observations of extensive ice cover across the islands. However, systematic quantitative measurements were unavailable until the Soviet aerial surveys of the 1950s, which produced the 1953 cartographic map now used as a historic DEM reference.
GRACE‑derived mass‑balance estimates for the early 2000s indicated a near‑neutral glacier budget (0 ± 2 Gt yr⁻¹) for Franz Josef Land, contrasting with the more negative trends observed on neighboring Novaya Zemlya and Svalbard (Jacob et al., 2012). This apparent stability set the stage for later detection of rapid acceleration.
Recent Research
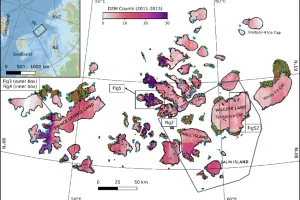
Since 2010, a series of coordinated remote‑sensing campaigns have mapped the archipelago at unprecedented resolution. The 2018 study by Zhenga et al. combined WorldView, SPOT, and CryoSat‑2 data with the 1953 map to produce a high‑resolution, island‑wide DEM series spanning 1953–2015. The analysis revealed a pronounced spatial heterogeneity in thinning, with the strongest rates (>10 m yr⁻¹) occurring on the southwestern flanks of the larger ice caps.
Key findings include:
| Period | Average Mass Loss (Gt yr⁻¹) | Mean Elevation Change (m yr⁻¹) |
|---|---|---|
| 1953–2011 | −2.18 ± 0.72 | −0.25 ± 0.08 |
| 2011–2015 | −4.43 ± 0.78 | −0.51 ± 0.09 |
The 2011‑2015 interval shows a doubling of the mass‑loss rate relative to the previous six‑decade average, confirming a marked acceleration in glacier dynamics.
What Has Changed
Three principal patterns emerge from the data:
- Accelerated thinning: Mean thinning rates increased from roughly −0.25 m yr⁻¹ (1953‑2011) to −0.51 m yr⁻¹ (2011‑2015), with localized hotspots reaching up to 10 m yr⁻¹. The spatial gradient shows greater loss toward the southwest, suggesting a combined effect of warmer maritime air masses and increased melt‑water runoff.
- Glacier retreat: Outlet glaciers have receded inland, exposing previously ice‑covered bedrock. At least one retreat has created a new island, evidence of rapid geomorphological response.
- Mass‑balance shift: The archipelago’s contribution to Arctic sea‑level rise, previously estimated at <1 mm yr⁻¹, is now projected to reach 2–3 mm yr⁻¹ if the 2011‑2015 trend persists, comparable to the projected 20–30 mm contribution from all Russian Arctic glaciers by 2100 (Radić et al., 2014).
These changes align with broader Arctic climate trends: average annual air temperatures in the Russian Arctic have risen at roughly twice the global rate over the past three decades, with winter (DJF) warming outpacing summer (JJA) warming (Walsh, 2009). Oceanic heat transport along the Barents Sea also contributes to basal melting of marine‑terminating outlet glaciers.
Uncertainty and Open Questions
Despite robust satellite coverage, several knowledge gaps remain:
- Sub‑glacial topography: Limited ice‑penetrating radar data hampers precise modeling of bed‑rock geometry, which influences glacier flow dynamics.
- Firn densification rates: Regional variations in snow accumulation and firn compaction affect the density conversion factor, introducing up to 15 % uncertainty in mass‑loss estimates.
- Ocean‑glacier interaction: Direct measurements of ocean temperature near marine‑terminating glaciers are scarce, limiting attribution of basal melt versus atmospheric forcing.
- Future scenario modeling: Coupled climate‑glacier models for the archipelago are still in development; projections depend heavily on assumptions about future Arctic amplification.
Addressing these uncertainties will require expanded field campaigns, including GPS stake networks, autonomous weather stations, and autonomous underwater vehicles to sample near‑glacier ocean waters.
Data Sources
Primary datasets include WorldView‑2/3 and SPOT‑5 stereo imagery (commercial providers), CryoSat‑2 Level‑2 altimetry (European Space Agency), and the digitized 1953 Soviet topographic map (archived at the Russian State Archive of the Navy). Supporting data are drawn from the National Snow and Ice Data Center (NSIDC) for ancillary climate variables, and from the Russian Arctic National Park’s monitoring program for ground‑truth observations.
FAQ
What is the overall rate of glacier mass loss in Franz Josef Land?
Between 2011 and 2015 the archipelago lost about 4.4 ± 0.8 Gt of ice per year, roughly double the average rate of the preceding six decades.
Which glaciers are thinning the fastest?
Localized thinning of up to 10 m yr⁻¹ has been recorded on the southwestern margins of the largest ice caps, particularly on the outlet glaciers of Rudolf and Hall Islands.
How does glacier loss in Franz Josef Land affect global sea level?
If the recent acceleration continues, Franz Josef Land could contribute 2–3 mm yr⁻¹ to global sea‑level rise, a small but growing fraction of the total Arctic contribution.
Leave a Reply