
Short Answer
Franz Josef Land, a high‑Arctic archipelago in the Barents Sea (approximately 81° N, 50° E), is covered by ice on roughly 80 % of its 16 000 km² surface. The majority of this ice is locked in dome‑shaped ice caps and outlet glaciers that discharge meltwater during the brief summer thaw. This meltwater, termed glacier runoff, follows steep valleys to the coast, feeds seasonal lakes and streams, and finally enters the Barents Sea, where it contributes to freshwater budgets, influences stratification, and supports marine life.
Because the islands are largely uninhabited and field infrastructure is sparse, runoff has historically been inferred from explorers’ qualitative observations and, more recently, from high‑resolution modelling forced by reanalysis climate data. The most comprehensive modern assessment is the CryoGrid simulation suite covering 1991–2022, which quantifies runoff on a 2.5 km grid and links meltwater generation to atmospheric forcing.
Understanding where the meltwater goes informs sea‑level rise estimates, helps predict changes in Barents Sea circulation, and provides baseline data for ecosystem monitoring in a region that is warming faster than the global average.
Study Area
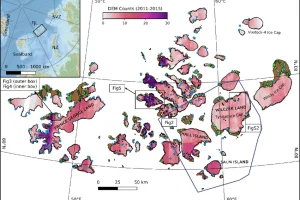
The study area comprises the entire Franz Josef Land archipelago, a chain of about 190 islands stretching roughly 320 km east‑west. The islands lie within the Russian Arctic National Park (established 2009) and are administered by Arkhangelsk Oblast. Elevations range from sea level to 935 m at the summit of the ice‑capped Kupol Vostok on Rudolf Island. Glaciated terrain includes the massive Kupol Vostok dome, the Nansen Ice Cap on Hall Island, and numerous outlet glaciers that terminate in tide‑water fjords such as the Zhuravlev Bay on Graham Bell Island.
What Scientists Measure
Modern investigations quantify glacier runoff through a combination of modelling, remote sensing, and limited in‑situ gauge data. The primary variables include:
| Parameter | Typical Units | Method |
|---|---|---|
| Runoff volume | km³ yr⁻¹ | CryoGrid model output, forced by CARRA reanalysis |
| Discharge at glacier termini | m³ s⁻¹ | Derived from model hydraulics; occasional field gauge measurements |
| Surface melt rate | mm w.e. day⁻¹ | Energy‑balance calculations within CryoGrid |
| Air temperature & precipitation | °C, mm yr⁻¹ | CARRA (Climate of the Arctic Reanalysis) dataset |
| Ice‑surface albedo | – | Satellite MODIS observations incorporated into model |
Historical Evidence
Early Arctic explorers recorded the presence of meltwater streams on Franz Josef Land. During the 1895 winter of the Fram expedition, Fridtjof Nansen noted “numerous rivulets descending from the ice caps and feeding shallow pools near Cape Flora” (Nansen, 1897). Similar observations appear in the reports of the 1900 Jackson–Harmsworth Expedition and the 1914–1915 Austro‑Hungarian North Pole Expedition, which described seasonal waterfalls and freshwater lakes forming on the ice‑free summer coast.
Recent Research
The most extensive recent dataset is the CryoGrid simulation of climatic mass balance and runoff for the period 1991–2022, produced by Louise Steffensen Schmidt and colleagues at the Norwegian Meteorological Institute. The model, driven by the CARRA reanalysis, operates on a 2.5 × 2.5 km grid and resolves runoff from each glacier across the archipelago (Schmidt 2023). Results are openly available through the Arctic Data Centre, providing monthly and annual runoff totals for individual glaciers and for the archipelago as a whole.
What Has Changed
Analysis of the CryoGrid output shows a clear upward trend in annual runoff. Between 1991 and 2000, mean annual runoff was roughly 0.12 km³ yr⁻¹, while the 2013–2022 decade averaged about 0.21 km³ yr⁻¹, representing a ~75 % increase. The acceleration aligns with documented regional air‑temperature rises of ~1.2 °C over the same period (IPCC, 2021). Seasonal patterns have also shifted: peak melt occurs earlier in June rather than July, and the melt season has lengthened by approximately three weeks.
Uncertainty and Open Questions
Key uncertainties stem from the scarcity of ground‑based discharge measurements, which limits validation of modelled runoff. The CryoGrid model assumes a uniform snow‑pack density and does not fully resolve sub‑glacial hydrology, potentially under‑estimating rapid drainage events. Open questions include the proportion of runoff that remains in inland lakes versus that reaching the coast, the impact of increasing freshwater input on Barents Sea stratification, and how future warming may alter glacier‑terminus dynamics (e.g., transition from tide‑water to land‑terminating glaciers).
Data Sources
Primary datasets and institutions supporting runoff research include:
- Norwegian Meteorological Institute – CryoGrid model development and simulations.
- Arctic Data Centre – open access to the 1991–2022 runoff dataset (doi:10.21343/k5gq-bh33).
- CARRA (Climate of the Arctic Reanalysis) – provides high‑resolution atmospheric forcing.
- Satellite remote‑sensing archives (MODIS, Sentinel‑2) – supply albedo and surface temperature inputs.
- Russian Arctic National Park authorities – facilitate limited field campaigns on selected islands.
FAQ
How is glacier runoff measured in such a remote area?
Runoff is primarily modelled using CryoGrid, which calculates melt based on energy balance and is forced by the high‑resolution CARRA reanalysis. Limited field gauges and satellite observations provide validation points.
What proportion of meltwater reaches the Barents Sea?
Most runoff from outlet glaciers drains directly to the coast via short streams and reaches the Barents Sea within days. A smaller fraction accumulates in seasonal lakes that may later evaporate or percolate into the permafrost.
Why does meltwater matter for the Barents Sea ecosystem?
Freshwater input lowers surface salinity, strengthening stratification, which can alter nutrient mixing, affect phytoplankton blooms, and thus influence the entire food web, including commercially important fish and marine mammals.

Leave a Reply